Bull markets versus bear markets
Recent stock market falls have unnerved many investors, but they may find comfort from the strong market bounce backs that have followed previous declines.
In the year to 31 October 2022, global shares (equities) fell by 22.3 per cent (1). This downturn was driven by a combination of rising interest rates, high inflation, the tragic events in Ukraine, and delays in the production and transportation of goods during and after the Covid-19 pandemic.
Such a steep drop in stock prices could, quite understandably, create nervousness among investors. At Schroders Personal Wealth (SPW) we call this part of the ‘rollercoaster of emotions’ that people can feel as they watch markets make large upward or downward fluctuations.
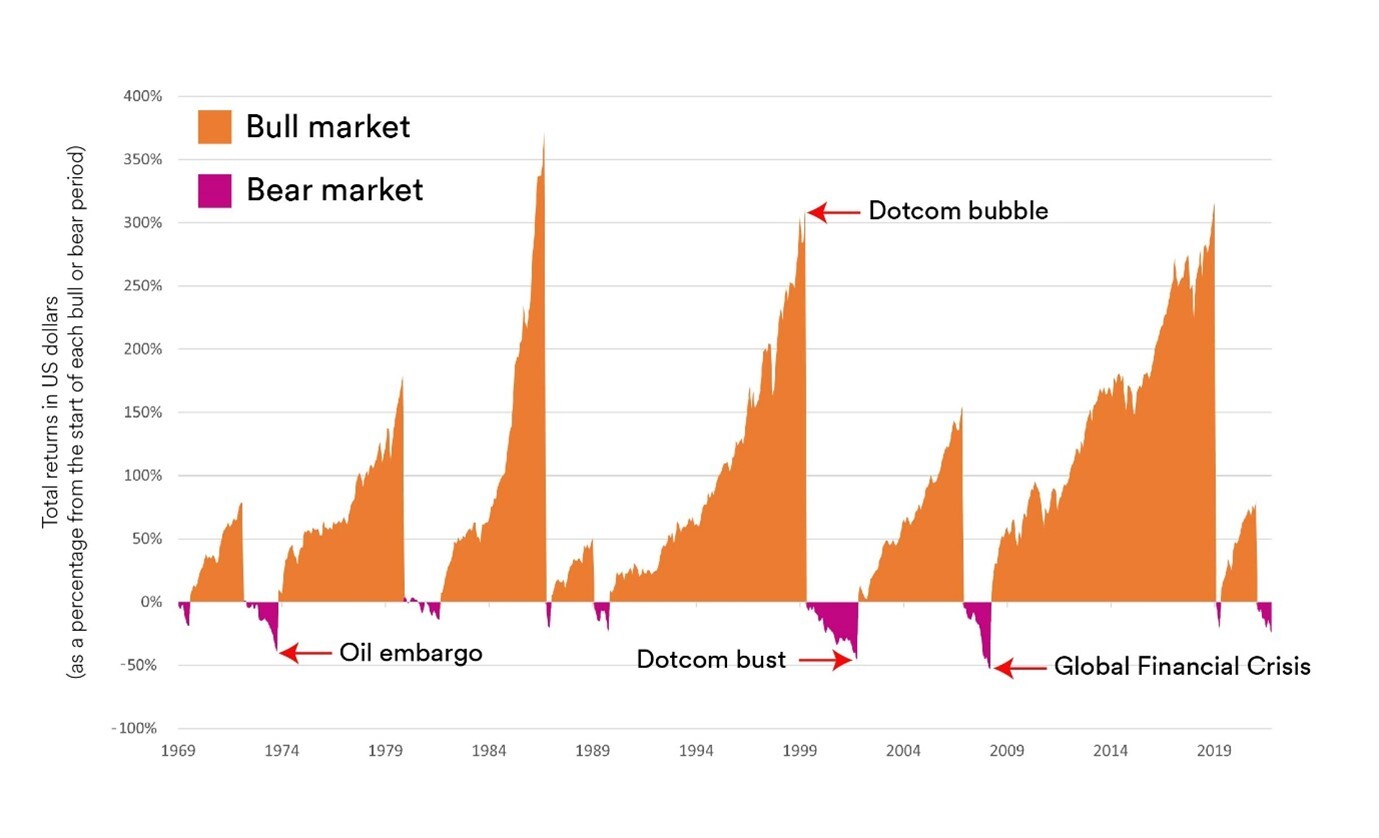
However, such declines in stock prices are not unusual and we believe they are a feature of stock market investing. As Chart 1 shows, since the start of 1970 there have been nine periods when global shares have fallen by more than 20 per cent, which are classed as bear markets.
Crucially, Chart 1 also shows that, in each case, the subsequent market upturn (or ‘bull market’) has been larger than the preceding fall. Bull markets are thought to get their name from the fact that a bull’s horns thrust upwards when the animal attacks. In contrast, bear markets get their name from the fact that a bear swipes downwards to attack.
Chart 1 is split up into separate bull and bear periods, each of which begins again from zero. So they can be considered as a series of charts run adjacent to each other.
Chart 1: Global bull markets versus global bear markets (total returns in US dollars)
The table below, which is based on Chart 1, shows that bull markets are, on average, much longer lasting than bear markets. Moreover, the average returns to investors from bull markets significantly outstrip the average losses to investors from bear markets. To provide some perspective: it took five years to register the biggest bull market gain of the period, of 372.1 per cent, and nearly two-and-a-half years to register the biggest bear market fall, at -53.7 per cent.
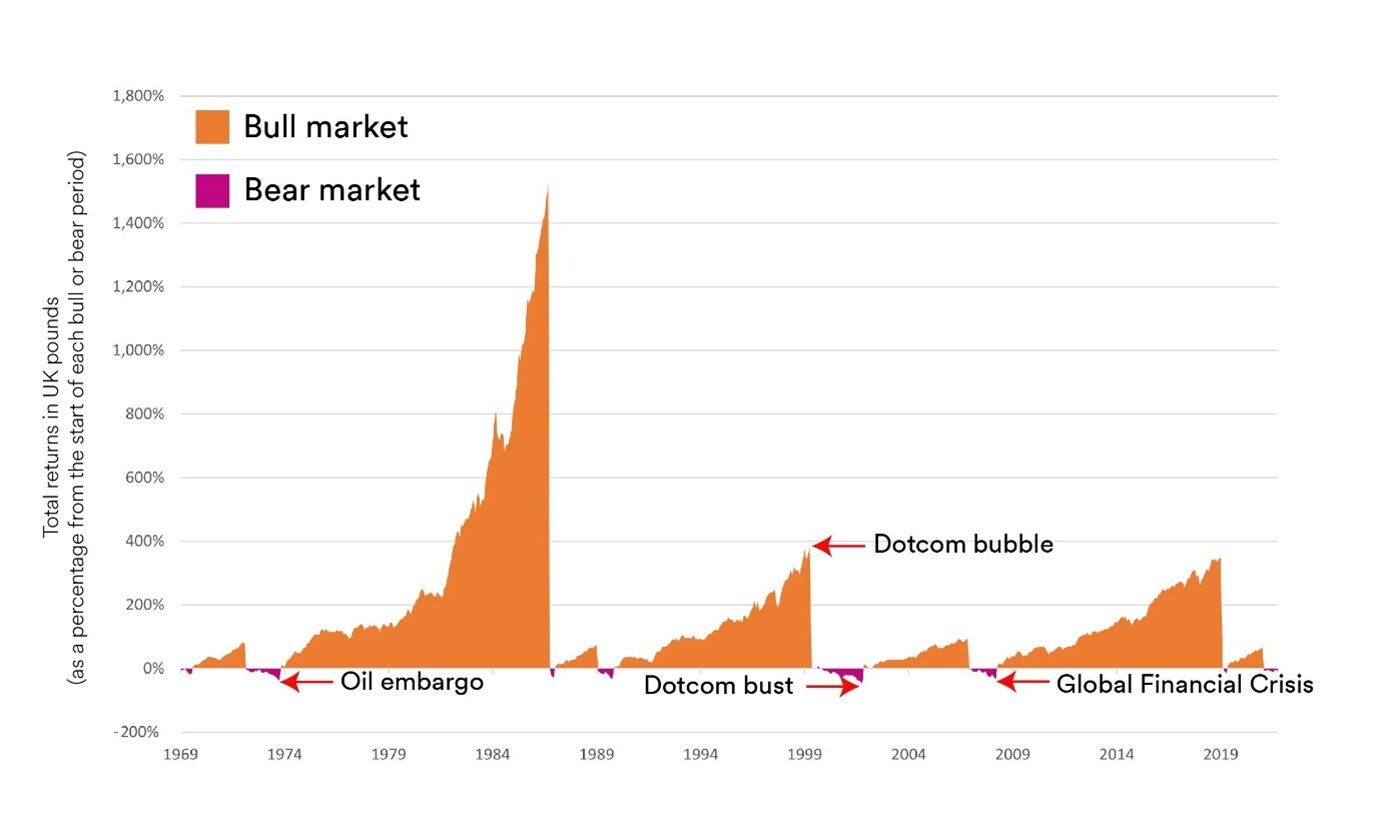
Charts 1 and 2 show the performance of MSCI World, an index of global shares, which reflects the fact that at SPW we are global investors. In this article I discuss the US dollar version of MSCI World (Chart 1), as the US stock market forms the largest geographical region in the index and the index is priced in dollars. Using the US dollar version also removes the impact of movements of sterling against the dollar. Those wanting to dig deeper will find a UK sterling version of the chart, and an explanation of how the charts were put together, at the end of this article.
I will now review the three deepest and longest-lasting bear markets since the start of 1970.
1973-74 Oil embargo
Global markets declined steeply in the 1973-74 period against the backdrop of the Arab oil embargo, which led to a fourfold increase in the price of oil. Meanwhile, the Bretton Woods Agreement collapsed. Under this arrangement, the US dollar was tied to the price of gold, while other currencies were then tied to the value of the dollar. Rising oil prices helped drive US inflation up from 2.4 per cent in August 1972 to 7.4 per cent in August 1973. The US central bank, the Federal Reserve, responded by increasing the interest rate to 13 per cent in the first half of 1974 (2) (3). The combination of high oil prices, high inflation, rising interest rates and declining stock markets has similarities with today’s economic climate.
2000 Dotcom crash
This crash followed on from the dot-com bubble. The bull market bubble was a rapid rise in valuations of technology companies, most notably internet-based businesses, during the late 1990s. The value of stock markets grew steeply during the dotcom bubble, due to a combination of faddish investing and an abundance of funding for start-up internet companies. Many of these companies lacked proper business plans, quickly used up their cash and folded, leading to a drop in investor sentiment and stock market declines between 2000 and 2002 (4).
2008 Global Financial Crisis
The financial crisis of 2007-08 resulted from cheap borrowing and slack lending standards, which created a housing bubble. When this burst, financial institutions found that investments apparently amounting to trillions of dollars were in fact based on worthless investments in mortgages from people with poor credit histories. The knock-on effects included a freezing of the global financial system, known as the credit crunch, and the collapse of Lehman Brothers, the biggest ever US bankruptcy. It was accompanied by steep stock market declines.
There were, however, resolutions to each of these events that allowed markets to return to bull runs.
- The oil embargo was lifted in March 1974, while the embargo led the US and western European nations to reassess their dependence on Middle Eastern oil (7).
- As the internet became established across the globe, some internet companies, including dotcom crash survivors Amazon and eBay, became global giants and supported the bull market of recent years.
- As the 2008 recession deepened, many governments stimulated their economies through increased spending and tax cuts. Meanwhile central banks, such as the US Federal Reserve and the Bank of England, reduced interest rates to ultra-low levels. This stimulated economic activity, boosted investor confidence, encouraged stock market investment and led to a bull market.
Unfortunately, the fact that each bear market in the charts was followed by a bigger bull market does not mean that this pattern will be repeated in the future. Even so, it could provide some comfort to investors understandably nervous about stock market volatility this year.
Looking again at Chart 1, it is clear that investors could have done very well indeed if they had sold their global shares at the peak of each bull market and then purchased them again at the bottom of each bear market. Unfortunately, it is very difficult to know in advance when we are reaching a bull market peak or a bear market bottom. Moreover, these investors could get their timings wrong, sell during a bear period, buy during a bull period and lose out on stock market returns as a result.
This explains why, at SPW, we believe investment is about spending time in the markets, rather than trying to time the markets. We also note that, at present, inflation is higher than interest rates available on most current and savings accounts. This means people holding cash are seeing the value of their money being eroded in real terms. In our view, people investing for the long term would benefit from staying invested in a diversified portfolio of assets with a level of risk that matches their circumstances.
Explanation of the charts
A bear market occurs when prices in a market decline by more than 20 per cent (9). So if the MSCI World index were to have fallen from a figure of, say, 10,000, to a figure of, say, 7,500, that would be a 25 per cent decline in stock prices, indicating a bear market. In this article, we have defined a bull market as one where market prices are generally rising and do not fall by more than 20 per cent from a peak.
While bear and bull markets are defined by the prices of an index, these do not reflect the returns to investors. That’s because many stocks in equity indices pay dividends to their investors, and these dividend payouts are not included in the prices of an index. In consequence, we have used ‘total returns’ rather than ‘price returns’ in Charts 1 and 2, as total returns include dividends. But we have followed convention and selected the bull and bear periods in Charts 1 and 2 on the basis of price returns. This explains why, in Chart 1, the beginning of the bear market of the early 1980s shows positive returns: the price of the index was falling but the total returns from the index were rising.
Chart 2: Global bull markets versus global bear markets (total returns in UK pounds)
Bull and bear markets are also calculated on the basis of the index’s local currency. The local currency for MSCI World is considered to be the US dollar. So we have based the bull markets and bear markets in Chart 2 on US dollar returns, even though this chart shows returns in UK sterling. The exception is for the bear market of the early 1980s, as stocks did not fall by 20 per cent in sterling terms. The reason for the high-returning bull market in the 1970s and 1980s in Chart 2 is the lack of an intervening 1980s bear market to break up the cumulative returns.
Chart 1 and Chart 2 are split up into separate bull and bear periods, each of which begins again from zero. So they can be considered as a series of charts run adjacent to each other. Chart 3, which is not split up into separate bull and bear periods, shows total returns in sterling terms for global shares for the entire period.
Sources
(1) MSCI AC World USD, FactSet, Schroders Personal Wealth.
(2) Investopedia, ‘The Oil Embargo Recession: November 1973–March 1975’, 16 June 2022.
(3) Investopedia, ‘Bretton Woods Agreement and the Institutions It Created Explained’, 21 March 2022.
(4) Investopedia, ‘Dotcom Bubble’, 25 June 2019.
(5) Investopedia, ‘The 2007–2008 Financial Crisis in Review’, 18 September 2022.
(6) Investopedia, ‘2008 Recession: What the Great Recession Was and What Caused It’, 26 May 2022.
(7) Britannica.com, ‘Arab oil embargo’, 27 October 2022.
(8) Federalreservehistory.org, ‘The Great Recession’, 22 November 2013.
(9) Investopedia, ‘Bear Market Guide’, 13 June 2022.
Important information
Any views expressed are our in-house views as at the time of publishing.
This content may not be used, copied, quoted, circulated or otherwise disclosed (in whole or part) without our prior written consent.
Fees and charges apply at Schroders Personal Wealth.
The value of investments and the income from them can fall as well as rise and are not guaranteed. Investors might not get back their initial investment.
There is no guarantee by investing money it will keep level or beat inflation, particularly when inflation is high.
Cash savings and investments are protected to the value of £85,000 per person per institution by the Financial Services Compensation Scheme (FSCS).
In preparing this article we have used third-party sources which we believe to be true and accurate as at the date of writing but can give no assurances or warranty regarding the accuracy, currency or applicability of any of the contents in relation to specific situations and particular circumstances.


